New Analysis

How to Read Analysis Results

Understanding Causal Impact Analysis

What is Causal Impact Analysis?

Causal Impact Analysis is a statistical method that estimates the causal effect of an intervention (like a Google Core Update) on a time series. It works by:

  1. Building a predictive model based on pre-intervention data
  2. Forecasting what would have happened without the intervention
  3. Comparing the forecast to what actually happened after the intervention

Reading the Causal Impact Summary Table

Metric % Change Causal Effect p-value Significant
Clicks -15.25% -18.40% 0.0012
  • Metric: The GSC metric being analyzed (Clicks, Impressions, CTR, Position)
  • % Change: The raw percentage change observed after the intervention
  • Causal Effect: The estimated percentage change attributed to the intervention
  • p-value: The probability that the observed effect occurred by chance. Lower values (typically < 0.05) indicate statistical significance
  • Significant: Whether the effect is statistically significant (✓) or not (✗)

Understanding Causal Impact Plots

Causal Impact plots typically show three panels:

  1. Original Time Series: Shows the actual data (solid line) and what would have happened without the intervention (dashed line)
  2. Pointwise Effect: Shows the difference between actual and predicted values at each time point
  3. Cumulative Effect: Shows the accumulated effect over time

The vertical dashed line indicates when the intervention (e.g., Google Core Update) occurred.

Example Causal Impact Plot

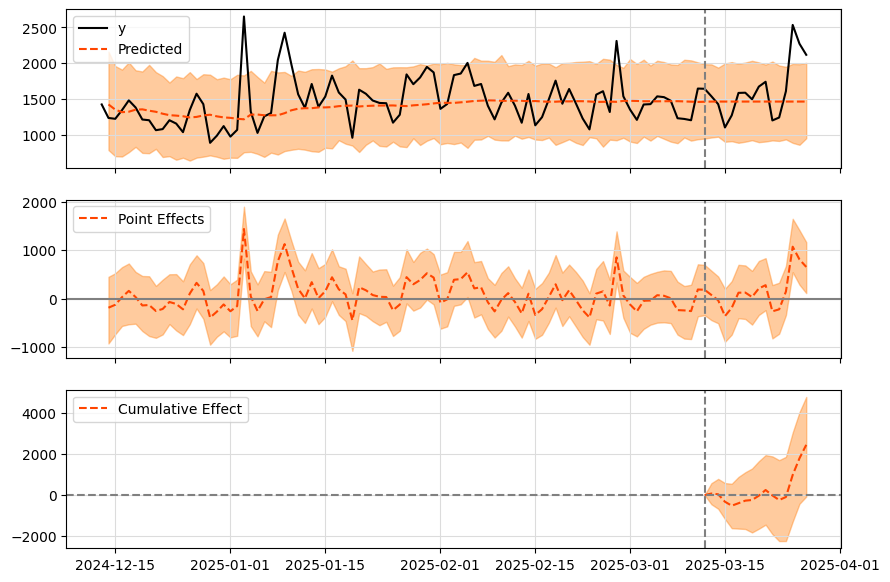
Example of a Causal Impact plot showing the three panels: original time series (top), pointwise effect (middle), and cumulative effect (bottom).

Interpreting Results

When analyzing causal impact results:

  • Look for statistically significant effects (p-value < 0.05)
  • Consider the magnitude of the causal effect
  • Examine the plots to see how the effect evolved over time
  • Remember that correlation doesn't always mean causation - other factors may be involved

Understanding Regression Analysis

What is Regression Analysis?

Regression Analysis is a statistical method that examines the relationship between a dependent variable (like clicks) and one or more independent variables (like time and the presence of a Google Core Update). It helps determine if the update had a statistically significant effect on your metrics.

Reading the Regression Summary Table

Metric % Change Regression Effect p-value Significant
Clicks -15.25% -0.182 0.0012
  • Metric: The GSC metric being analyzed (Clicks, Impressions, CTR, Position)
  • % Change: The raw percentage change observed after the update
  • Regression Effect: The coefficient for the update variable in the regression model
  • p-value: The probability that the observed effect occurred by chance. Lower values (typically < 0.05) indicate statistical significance
  • Significant: Whether the effect is statistically significant (✓) or not (✗)

Understanding Regression Plots

Regression analysis plots typically show:

  1. Raw Data: The actual metric values over time
  2. Regression Line: The fitted model showing the trend before and after the update
  3. Effect Plot: Visual representation of the update's effect

The vertical line or shaded area indicates when the Google Core Update occurred.

Interpreting Results

When analyzing regression results:

  • Focus on the p-value to determine statistical significance (typically < 0.05)
  • Look at the regression effect to understand the magnitude and direction of impact
  • Consider the percentage change to understand practical significance
  • Examine the plots to see if the model fits the data well
  • Remember that the model controls for other factors like day of week

Comparing Analysis Methods

Causal Impact vs. Regression Analysis

Both methods help analyze the effect of Google Core Updates, but they have different strengths:

Feature Causal Impact Regression Analysis
Best for Time series with clear pre/post periods Controlling for multiple variables
Handles seasonality Yes, automatically Yes, with explicit variables
Prediction method Bayesian structural time series Linear regression
Interpretation More intuitive visual results More detailed statistical output

Which Method Should I Trust?

For the most comprehensive understanding, consider both methods together:

  • When both methods agree, you can be more confident in the results
  • When they disagree, examine the assumptions of each model
  • Causal Impact may be better for capturing complex time series patterns
  • Regression may be better when you need to control for specific variables

Remember that statistical analysis is just one tool for understanding the impact of Google Core Updates. Always combine these insights with qualitative analysis of your content, user behavior, and industry trends.